Romania Forest Lab · Whole massif study · 28 October 2026
Forest area and canopy give different answers in Retezat.
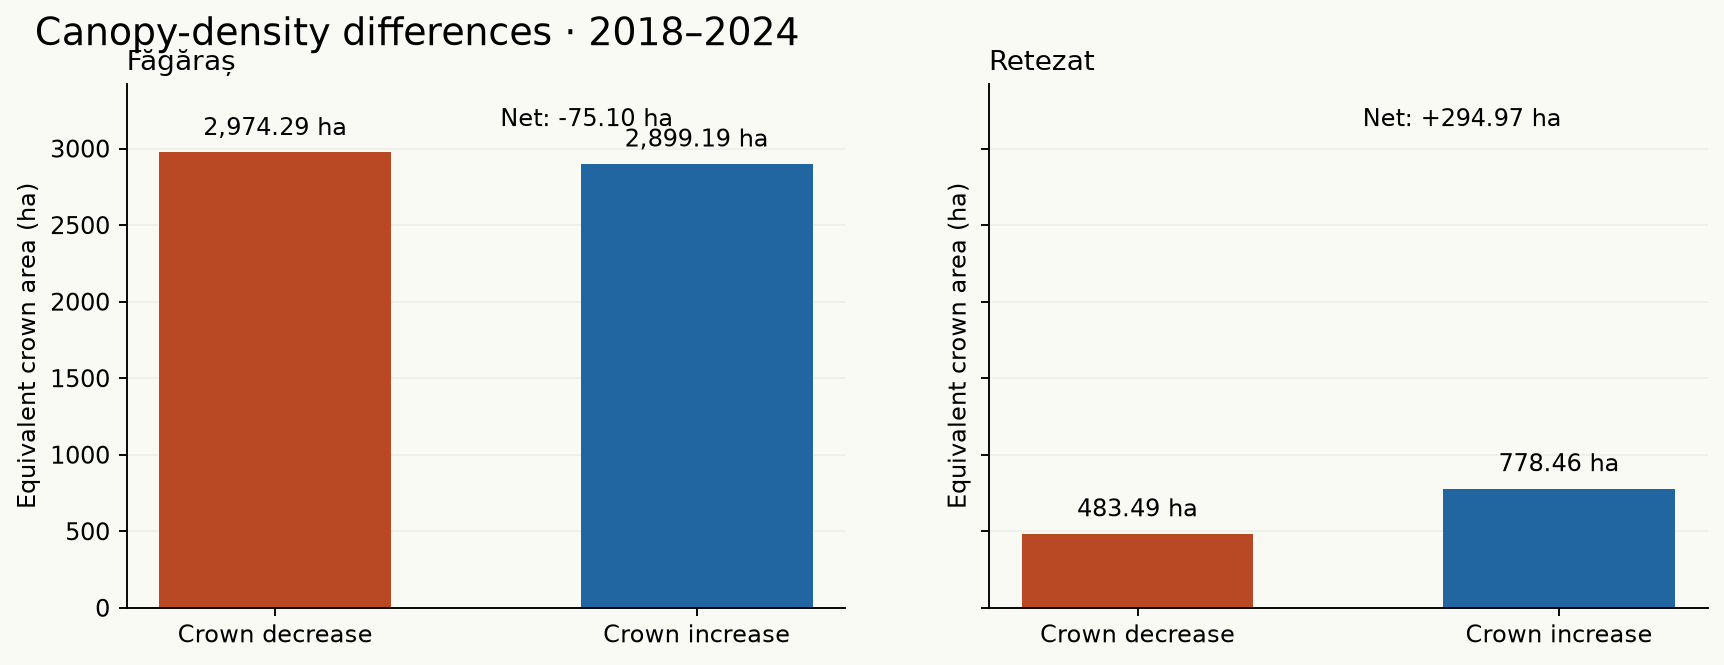
ForTy maps less forest in both massifs during 2017–2025. Copernicus maps a small crown-area decrease in Făgăraș and an increase in Retezat during 2018–2024. These are different periods and measurements.
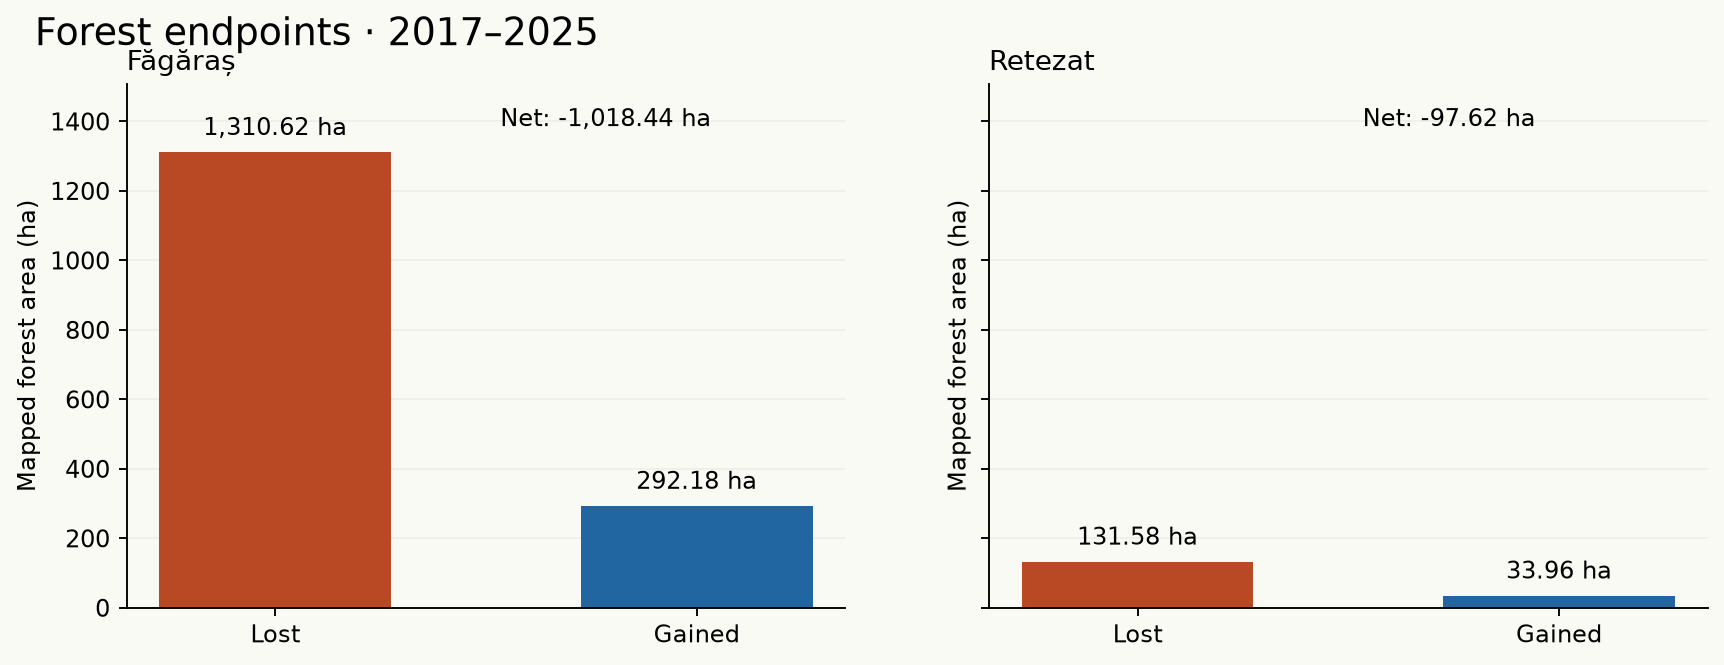
| Massif | 2017 forest (ha) | Lost (ha) | Gained (ha) | Net (ha) | Net / baseline |
|---|---|---|---|---|---|
| Făgăraș | 116,075.72 | 1,310.62 | 292.18 | -1,018.44 | -0.877% |
| Retezat | 31,839.06 | 131.58 | 33.96 | -97.62 | -0.307% |
These totals measure changes in modelled forest classes. They are not validated inventory estimates, canopy-density measurements, or proof of permanent deforestation.
Endpoint change and temporary disturbance answer different questions.
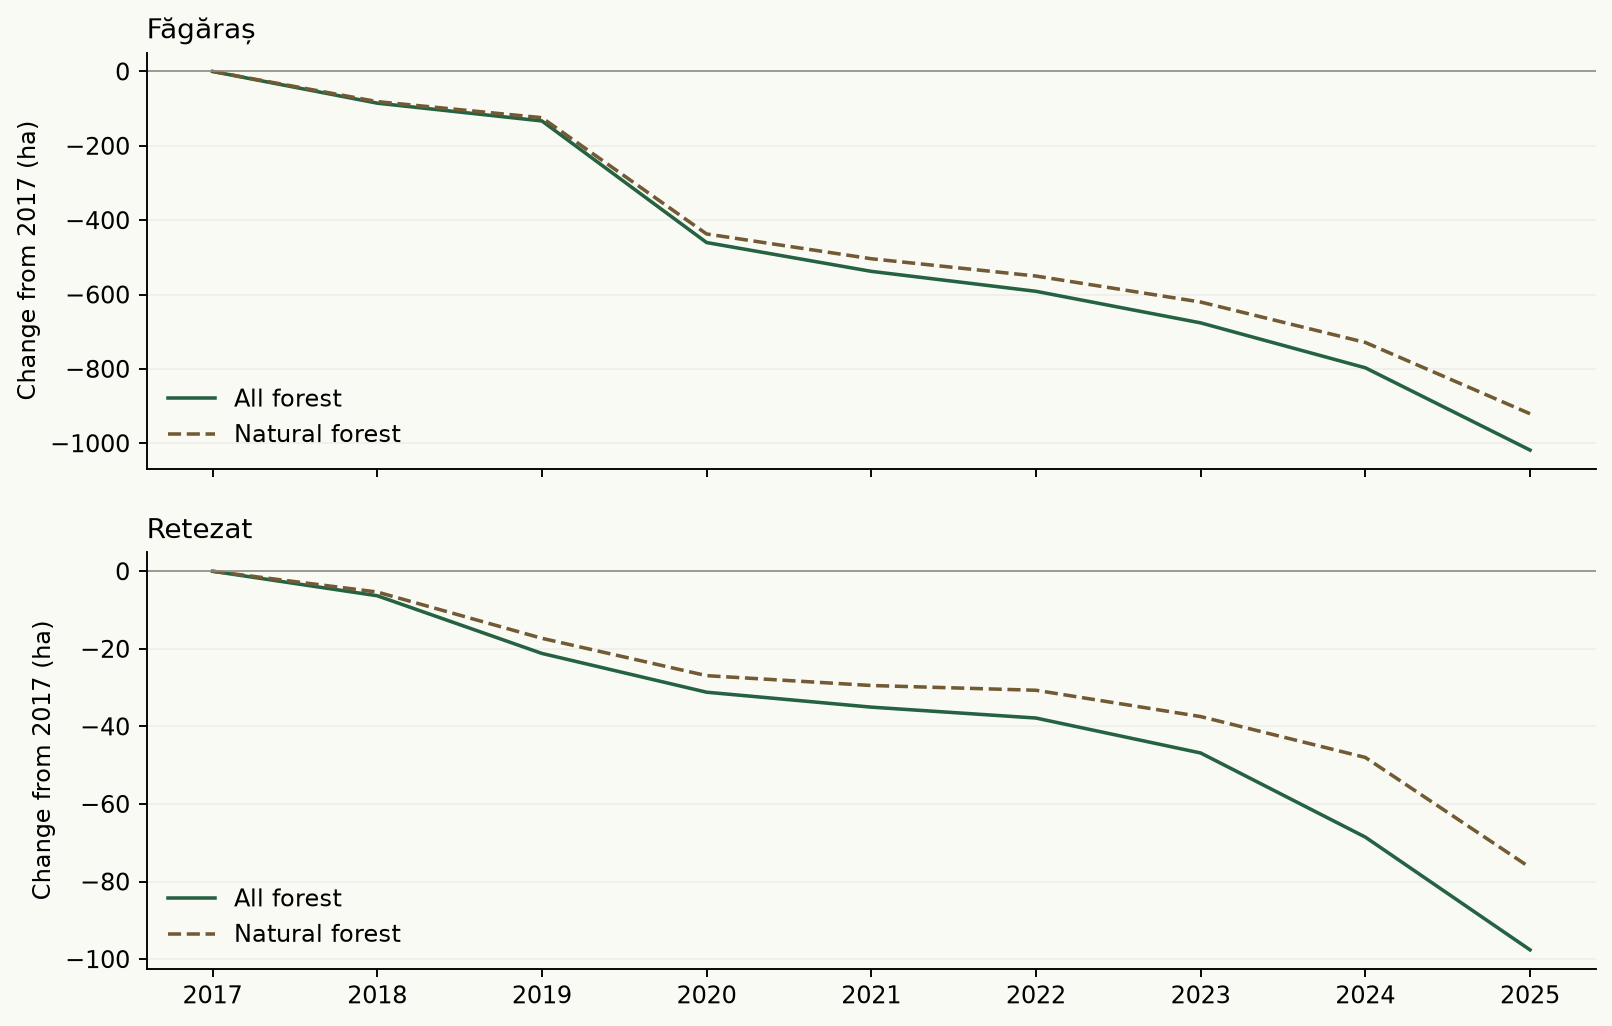
| Massif | Natural loss (ha) | Natural gain (ha) | Natural → planted (ha) | Forest recovered by 2025 (ha) |
|---|---|---|---|---|
| Făgăraș | 1,196.40 | 275.69 | 0.01 | 185.88 |
| Retezat | 102.20 | 25.83 | 0.00 | 11.25 |
A pixel forested in both endpoints can lose its forest label and recover between them. Recovery totals follow cells forested in 2017; later forest gains are represented in annual turnover. Recovery here means a return to a modelled forest class. It does not establish mature canopy, ecological restoration, or recovery of biodiversity. Natural-to-planted conversion is included in natural-forest loss, but is not total-forest loss.
The measurements follow the massif polygons.
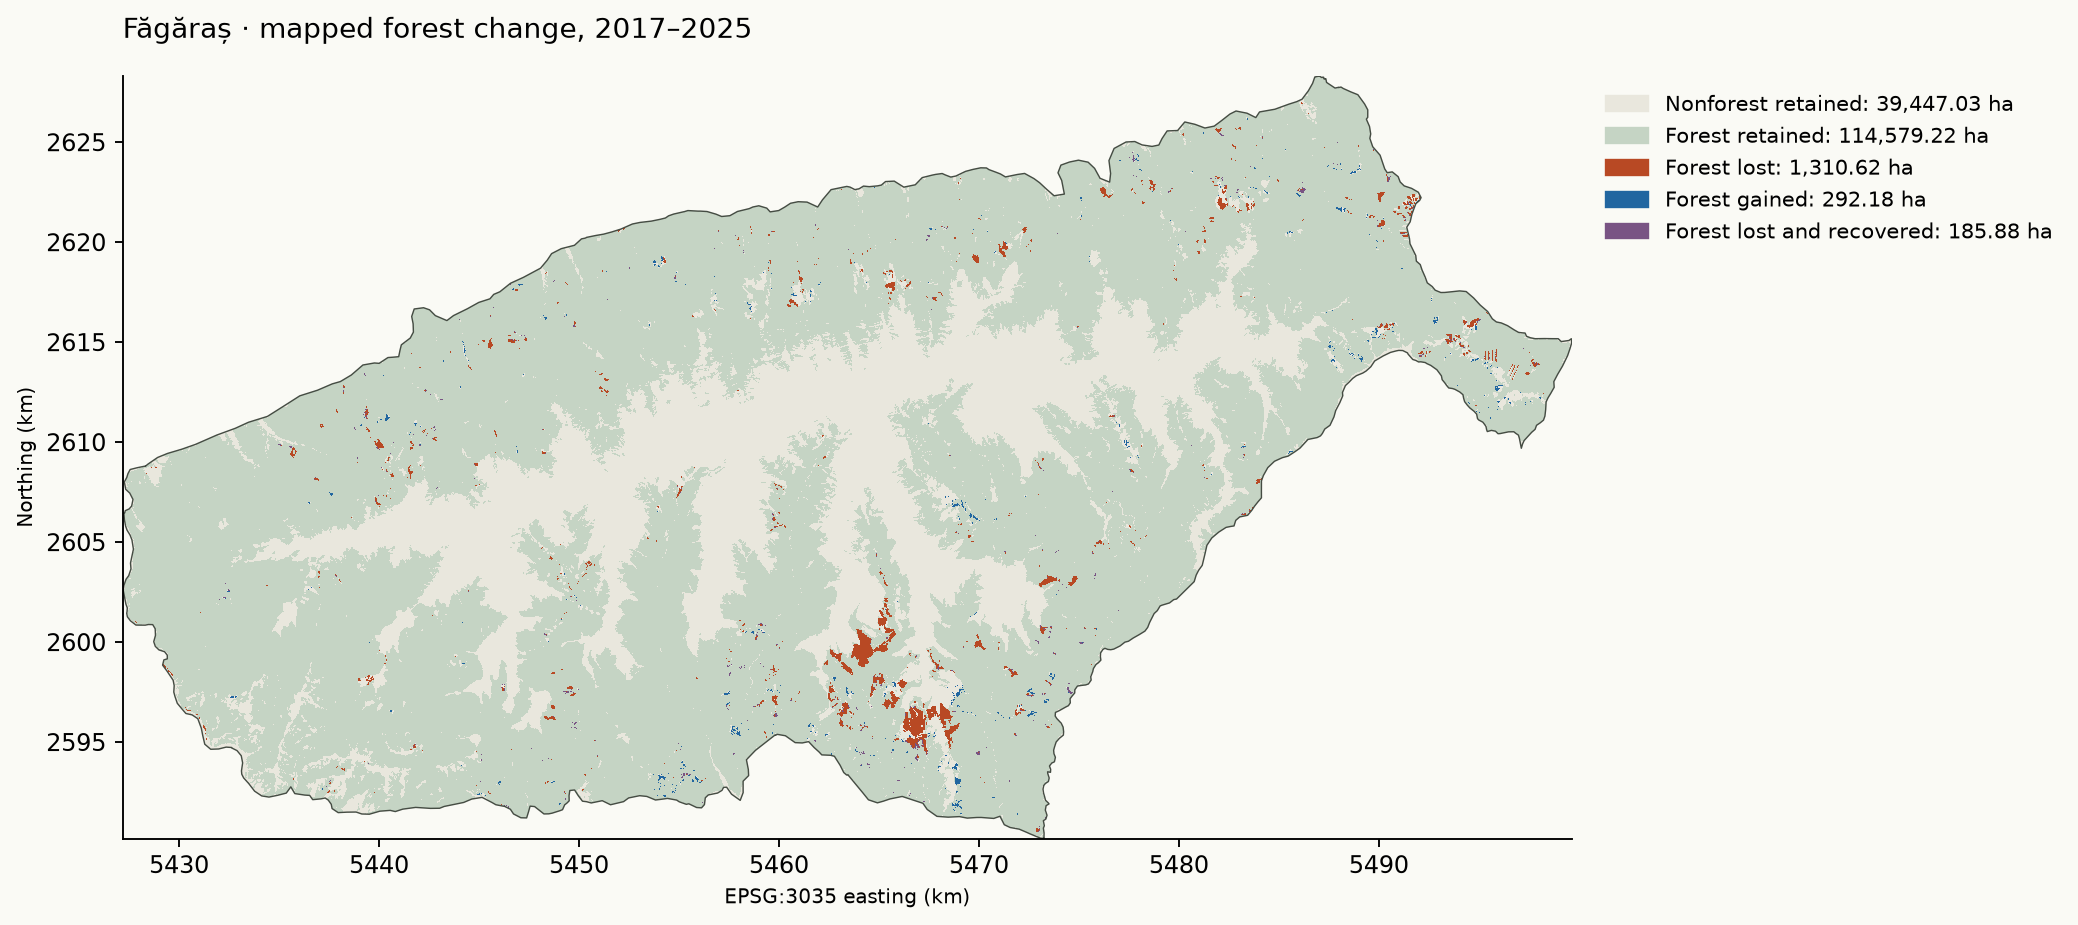
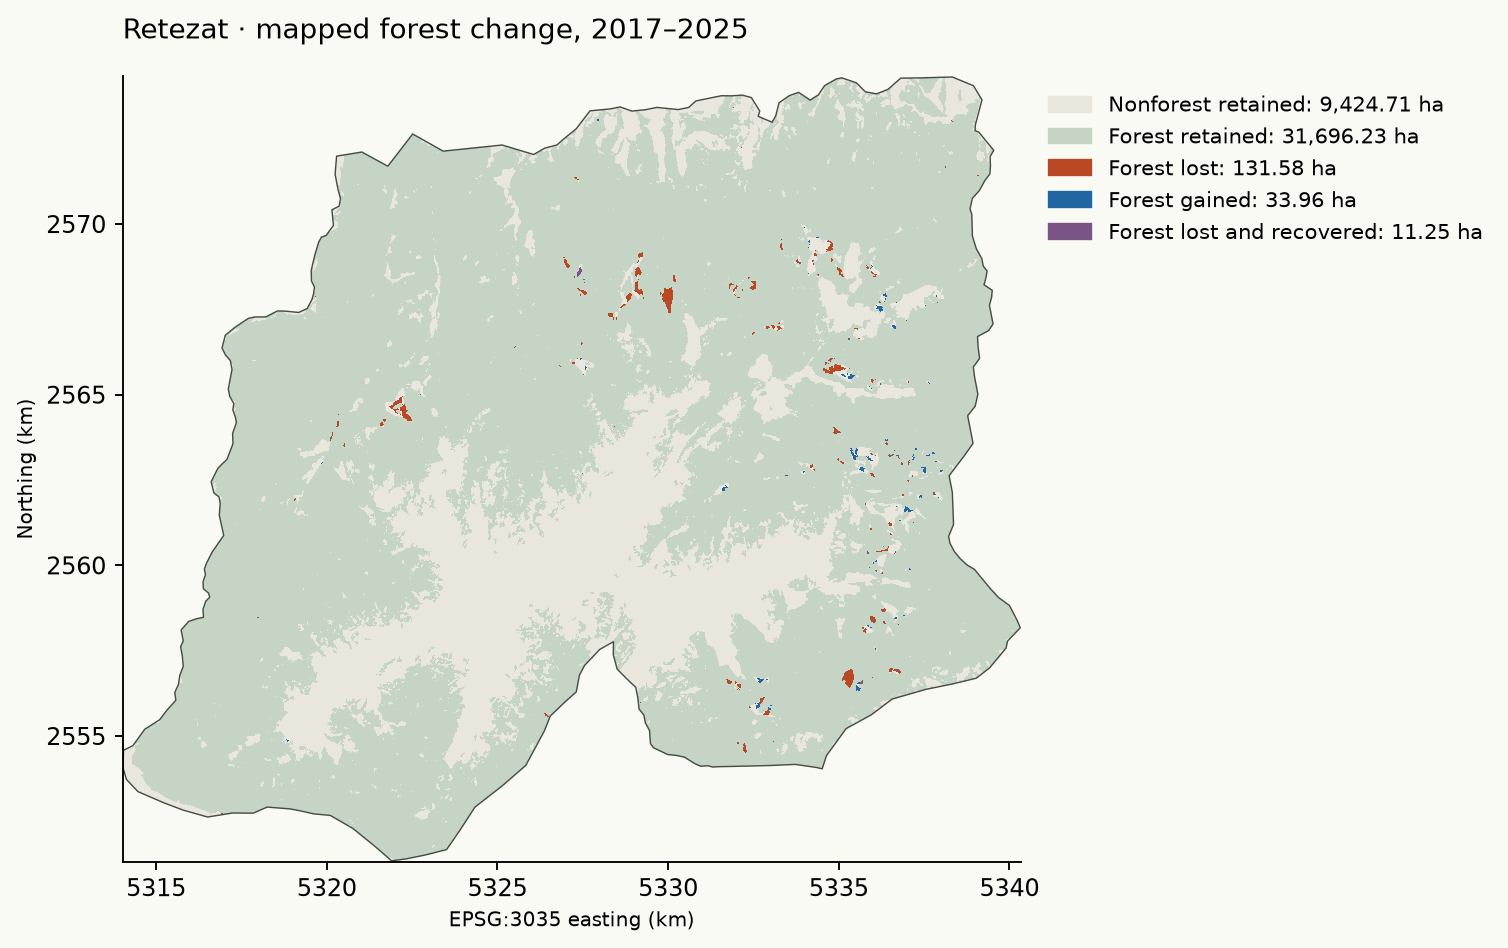
The figures use analytical rasters, not browser map tiles. Download the 10 m GeoTIFFs to inspect small changes that may be difficult to see at report scale.
Changing the screening rule changes which hectares qualify.
| Massif | Rule | Score ≥ | Lost (ha) | Gained (ha) | Net (ha) | Excluded (ha) |
|---|---|---|---|---|---|---|
| Făgăraș | Raw endpoints | 0.0 | 1,310.62 | 292.18 | -1,018.44 | 0.00 |
| Făgăraș | Raw endpoints | 0.5 | 1,275.85 | 286.55 | -989.30 | 854.40 |
| Făgăraș | Raw endpoints | 0.7 | 534.08 | 183.16 | -350.92 | 26,226.75 |
| Făgăraș | Raw endpoints | 0.9 | No eligible cells | — | — | 155,814.93 |
| Făgăraș | Stable endpoints | 0.0 | 1,023.81 | 288.97 | -734.84 | 356.89 |
| Făgăraș | Stable endpoints | 0.5 | 992.07 | 277.76 | -714.31 | 1,239.11 |
| Făgăraș | Stable endpoints | 0.7 | 354.77 | 129.50 | -225.27 | 26,567.59 |
| Făgăraș | Stable endpoints | 0.9 | No eligible cells | — | — | 155,814.93 |
| Retezat | Raw endpoints | 0.0 | 131.58 | 33.96 | -97.62 | 0.00 |
| Retezat | Raw endpoints | 0.5 | 129.42 | 31.54 | -97.88 | 214.06 |
| Retezat | Raw endpoints | 0.7 | 69.36 | 14.46 | -54.90 | 7,772.76 |
| Retezat | Raw endpoints | 0.9 | No eligible cells | — | — | 41,297.73 |
| Retezat | Stable endpoints | 0.0 | 96.27 | 32.29 | -63.98 | 40.79 |
| Retezat | Stable endpoints | 0.5 | 92.53 | 28.84 | -63.69 | 261.86 |
| Retezat | Stable endpoints | 0.7 | 37.41 | 8.02 | -29.39 | 7,824.73 |
| Retezat | Stable endpoints | 0.9 | No eligible cells | — | — | 41,297.73 |
Raw endpoints use all common valid cells. Stable endpoints require the same binary forest status in 2017/2018 and in 2024/2025. Score filters apply to the maximum native-class score at both endpoints, or all four years for stable endpoints. Excluded cells contribute to neither loss nor gain. Each row has its own eligible support; the variations are not statistical confidence intervals.
Canopy disturbance stays separate from forest-type balance.
| Massif | Hansen loss (ha) | Both products (ha) | ForTy loss only (ha) | Hansen loss only (ha) |
|---|---|---|---|---|
| Făgăraș | 2,545.69 | 1,102.83 | 207.79 | 1,442.86 |
| Retezat | 180.12 | 85.34 | 46.24 | 94.78 |
Hansen years 2018–2025 are compared on an aligned 30 m equal-area grid using fractional 10 m support. The baseline filter is ForTy forest in 2017; no year-2000 canopy-density threshold was applied. These counts therefore differ from default Global Forest Watch statistics. Loss can reflect harvest, mortality, fire, or other disturbance. Repeated losses at one pixel are not fully represented.
Hansen overlap measures cross-product agreement, not independent validation. Hansen detects canopy disturbance while ForTy predicts land-use types; differences can be legitimate. Their loss and gain totals cannot be mixed into a net figure.
Copernicus compares canopy during 2018–2024.
| Massif | Period | Canopy lost (ha) | Canopy gained (ha) | Canopy net (ha) | ForTy forest net (ha) |
|---|---|---|---|---|---|
| fagaras | 2018–2021 | 501.60 | 39.88 | -461.72 | -452.45 |
| fagaras | 2021–2024 | 239.44 | 77.12 | -162.32 | -259.41 |
| retezat | 2018–2021 | 23.52 | 2.52 | -21.00 | -28.72 |
| retezat | 2021–2024 | 9.00 | 181.84 | +172.84 | -33.51 |
| Massif | Crown decrease (ha) | Crown increase (ha) | Net crowns (ha) |
|---|---|---|---|
| fagaras | 2,974.29 | 2,899.19 | -75.10 |
| retezat | 483.49 | 778.46 | +294.97 |
Presence change measures tree-covered extent on a 20 m grid. The ForTy column uses matching years, but different definitions: forest land use can persist through temporary canopy removal. Density measures vertical crown projection on 10 m cells: sum(density/100 × 0.01 ha). Positive and negative density differences are spatial changes between 2018 and 2024, not cumulative annual events. The presence-change product is marked not validated by Copernicus.
Every total has fixed support and a reproducible definition.
- Făgăraș: polygon 552, 1,558.15 km²; analytical grid 155,814.93 ha; common coverage 100.000%; excluded missing data 0.00 ha.
- Retezat: polygon 576, 412.97 km²; analytical grid 41,297.73 ha; common coverage 100.000%; excluded missing data 0.00 ha.
Boundaries follow the 2008 Romanian relief dataset after Posea and Badea’s geographical regionalization. They are generalized massif polygons, not cadastral or park boundaries. The WGS84 download omits its projection file; the publisher’s GCS_WGS84 designation is used explicitly.
Forest comprises native beta classes 1, 2, 3, 4, and 7. Natural forest comprises 1, 2, and 7. Tree crops remain separate. Each 10 m cell represents 0.01 ha. The common mask requires valid observations in all nine years, with at least 99% coverage. Pixel centres decide polygon membership; raster and vector areas differ slightly at edges.
All years use ForTy v2 beta. No v1 baseline is spliced into the series. Sorted first-valid tile ownership prevents duplicate area. Sources are cached with hashes and generations where supplied. Scores remain uncalibrated model confidence; they are not canopy fractions. Classification changes and temporarily unstocked forest can resemble loss or recovery.
Rerun: uv run --project research forest-lab balance. After all source files are cached: FOREST_LAB_OFFLINE=1 uv run --project research --offline forest-lab balance. Focused checks: uv run --project research --offline pytest -q research/tests/test_balance.py.
Change rasters: 0 outside/excluded; 1 nonforest retained; 2 forest retained; 3 endpoint loss; 4 endpoint gain; 5 forest lost and recovered by 2025. Each annual raster band preserves native classes 1–7.
- Summary
- Annual balance
- Sensitivity
- Hansen comparison
- Boundaries
- Source manifest
- Verification
- Făgăraș annual class raster
- Făgăraș forest change raster
- Făgăraș natural forest change raster
- Făgăraș transition matrix
- Retezat annual class raster
- Retezat forest change raster
- Retezat natural forest change raster
- Retezat transition matrix
- Canopy extent table
- Canopy density table
- Făgăraș crown-density change raster
- Făgăraș canopy presence 2018–2021
- Făgăraș canopy presence 2021–2024
- Retezat crown-density change raster
- Retezat canopy presence 2018–2021
- Retezat canopy presence 2021–2024
Sources and interpretation limits
- Romanian relief boundaries, Bogdan Candrea, Petronela Candrea, Mihai Daniel Niță; geographical regionalization after Posea and Badea (1984).
- ForTy release and early annual series, Neumann and colleagues, Google DeepMind / Google Research / WRI / IIASA (2026).
- Official ForTy beta explorer and native band definitions.
- Hansen Global Forest Change 2025 v1.13, University of Maryland / Google / USGS / NASA.
- Copernicus Tree Cover Density and Tree Cover Presence Change, European Union, EEA / JRC.
- WRI interpretation and comparability limits.
No field verification, causal attribution, legal determination, or local accuracy estimate is included. Layout uses the lab’s bundled Visual Explainer shell under its existing MIT license.